Ads Manager gives you control over which metrics are visible and how the data is filtered. This page covers the metric toggle, objective filter, date range picker, and how performance thresholds work.
Metric toggle
At the top-left of the filter bar, you’ll see three buttons:
Shows revenue-focused columns:| Column | Description |
|---|
| Revenue | Total revenue from ad-attributed purchases |
| ROAS | Return on Ad Spend (revenue / spend) |
| Purchases | Number of conversions |
| CPA | Cost per acquisition (spend / purchases) |
| AOV | Average order value (revenue / purchases) |
Shows lead-focused columns:| Column | Description |
|---|
| Leads | Total leads generated |
| CPL | Cost per lead (spend / leads) |
| Lead Rate | Leads as a percentage of impressions |
Shows all columns from both Sales and Leads at once. Useful if you’re running campaigns with mixed objectives.
Universal columns
Regardless of which metric mode you select, these columns are always visible:
| Column | Description |
|---|
| Name | Campaign, ad set, or ad name |
| Status | Active, Paused, Completed, etc. |
| Daily Budget | The daily spend cap (campaigns and ad sets only) |
| Spend | Total amount spent in the selected date range |
| Reach | Unique users who saw the ad |
| Impressions | Total ad views (including repeated views) |
| Clicks | Link clicks on the ad |
| CTR | Click-through rate (clicks / impressions) |
| CPC | Cost per click (spend / clicks) |
| CPM | Cost per 1,000 impressions |
Objective filter
On the Campaigns tab, you’ll see an Objective dropdown. This lets you filter campaigns by their Meta objective type (Sales, Leads, Traffic, etc.).
- You can select multiple objectives at once using checkboxes.
- A Select All option is available at the top.
- The dropdown shows how many objectives are selected (e.g., “2 selected”).
The objective filter only appears on the Campaigns tab. Ad Sets and Ads inherit the filter from the campaign selection.
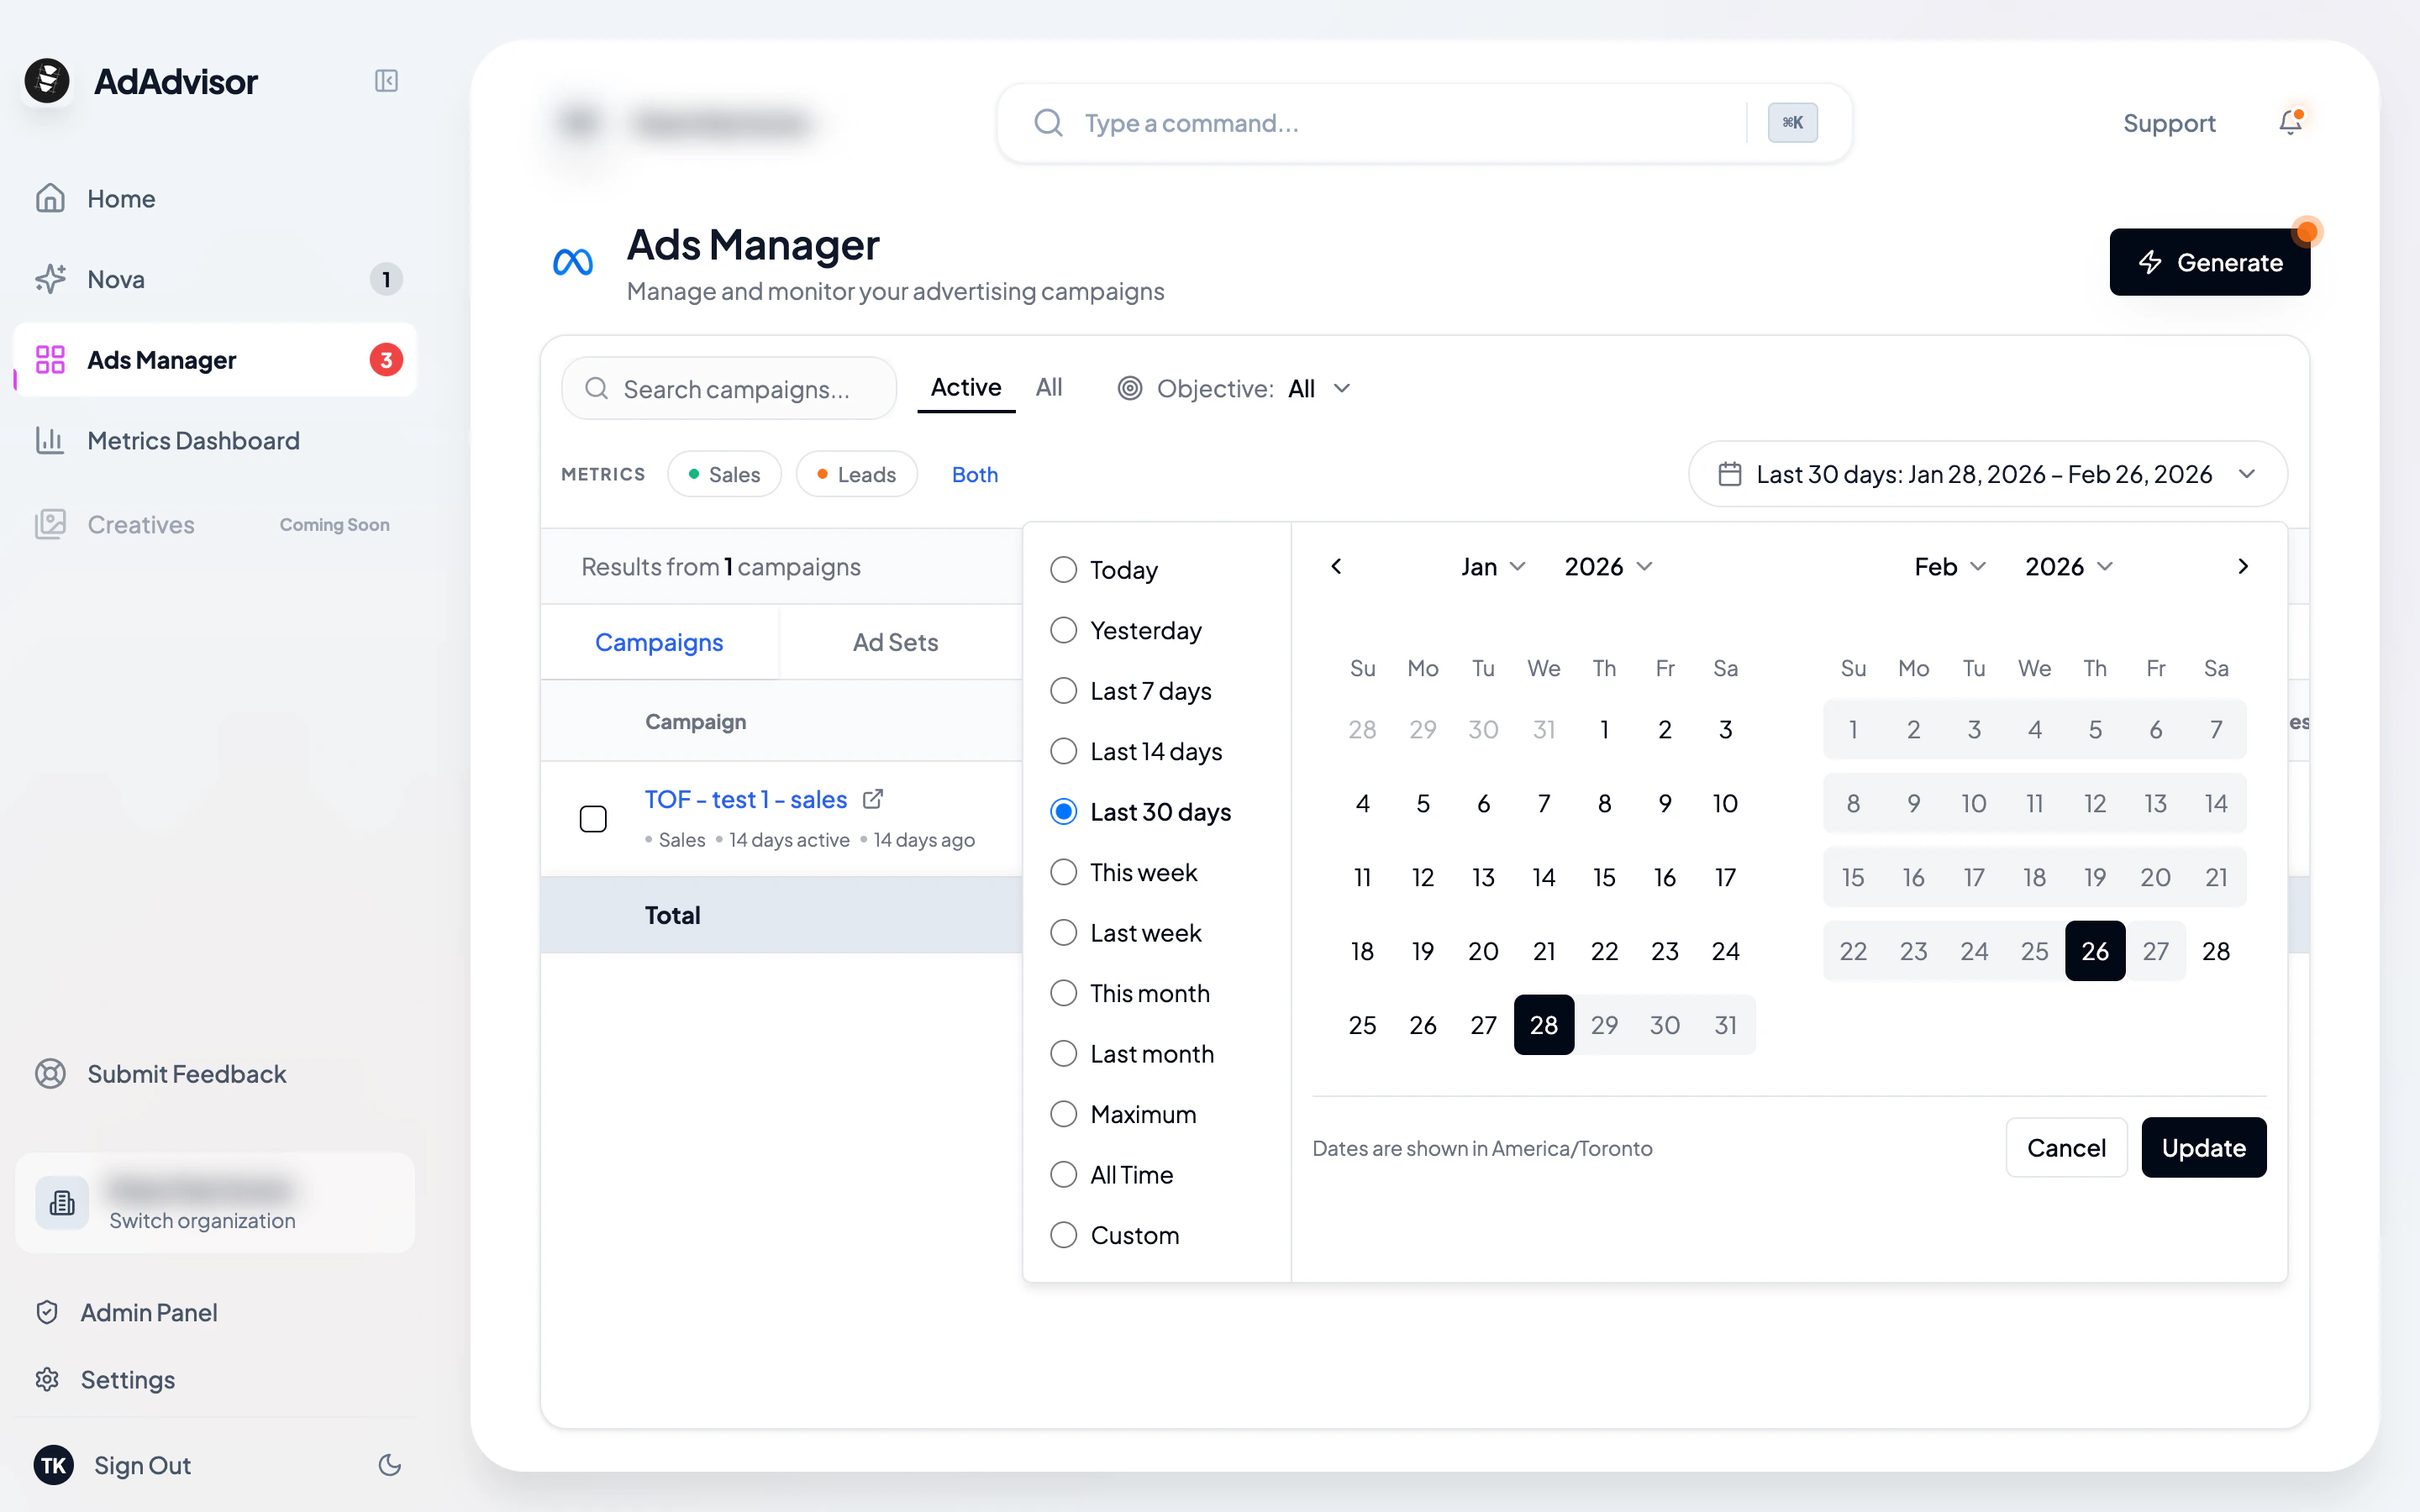
Date range picker
On the right side of the filter bar, the date range picker lets you choose the time period for all the metrics in the table.
Click it to see preset options or define a custom range. The metrics in every column and the totals row will update to reflect the selected period.
Just like on the dashboard, Ads Manager color-codes key metrics based on your business targets:
ROAS thresholds
If you’ve set a break-even ROAS on your business:
- Green: ROAS is at or above your break-even target
- Yellow: ROAS is between 80-100% of target
- Red: ROAS is below 80% of target
CPL thresholds
If you’ve set a target CPL:
- Green: CPL is at or below target
- Yellow: CPL is between 100-125% of target
- Red: CPL is above 125% of target
If you haven’t set business metrics (break-even ROAS, target CPL), the color coding won’t appear. You can set these in Settings > Businesses by editing your business.
- Your business has the required metrics set (AOV, daily budget cap, and either break-even ROAS or target CPL)
- Your data is synced
- You haven’t already generated within the last 24 hours
- Any previous recommendations have been acted on or dismissed
If any check fails, you’ll see a message explaining what’s needed before you can generate.